Interesting point of view. Loved the emperor's new clothes analogy to crypto. I feel the same way about it. That said, I have a few criticisms (forgive me, it's what I do and probably tldr).
They didn't quite sell me on the idea that we are dealing with a
super bubble, although I agree it's a possibility. Maybe just a small bubble though.
The three super bubble indicators they presented are based on technical indicators not fundamentals. The idea that economic growth will forever follow a single long term trend line is unlikely to be true. It's not even clear in this case whether they are adjusting the trend for inflation. Also, measuring the technical indicators from the covid panic bottom could be problematic given how unusual the market conditions were.
From a fundamentals point of view, the most recent super bubbles were fraught with issues. With the dot coms there were tons of companies that were trading at insane market caps (can't point to multiples as many weren't even making money) with no real plan to ever be profitable. It was like instead of one GME there were a hundred of them making up a significant share of the market. With the housing bubble there were so many fundamental issues it would be difficult to list them all.
When I look at the value of equities from a price to earnings standpoint (one fundamental POV), I think of it in the context of interest rates and other investment options available. The value of equities is really a function of 2 components: earnings and growth. If you take the reciprocal of the PE ratio, you can get an idea of what the ROI would be from a stock if expected growth was zero.
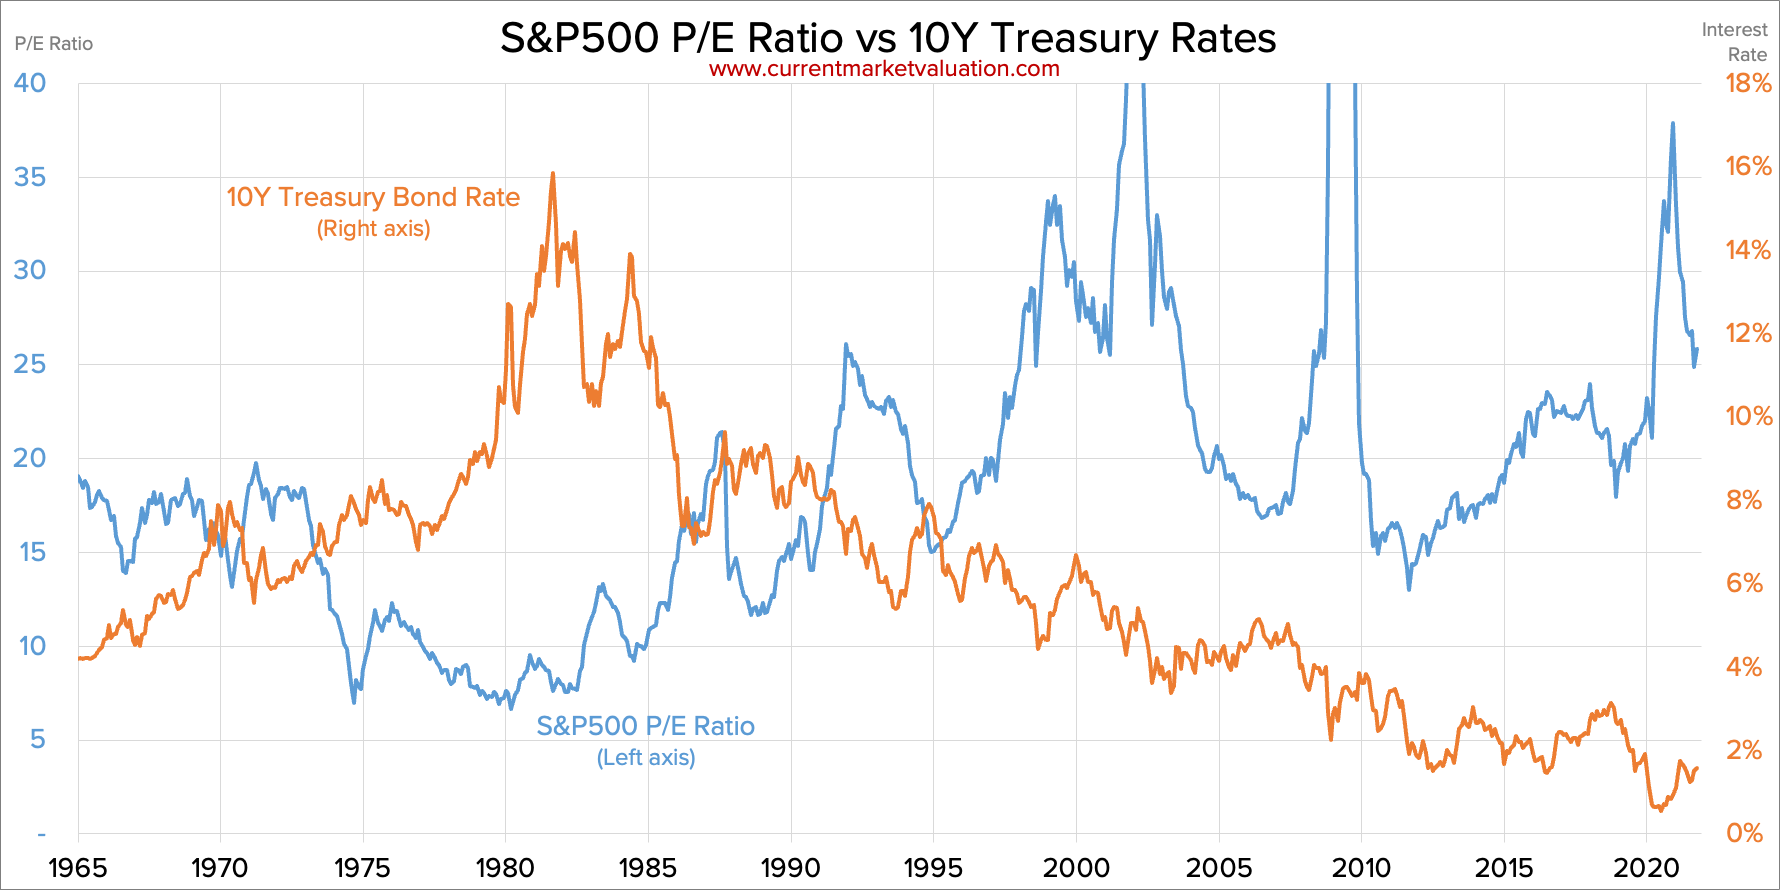
Following that thread, if you look at the chart I posted previously, the low point for the s&p 500 PE was around 7 in 1980. That's an implied ROI of about 14% assuming no growth. That sounds wonderful until you consider that the 10 year treasury rate was about 14% at that time. That says that investors must have been counting on plenty of growth to cover the risk premium between equities and treasuries.
If you grab another data point on the higher end of the market PE, like 1999, you see the s&p 500 with a PE of around 34. That's an implied ROI of about 3% assuming no growth. The 10 year treasury rate was 5% at the time. That says that investors expectations for growth were probably too high. Irrationally exuberant one might say and ripe for a correction.
If you look at the most recent data point, a PE of 25, that's an implied ROI of about 4% assuming no growth. With the 10 year treasury rate below 2% it looks like investors are more conservative about their growth expectations today and allowing a risk premium on equities even when ignoring growth.
Here's an article discussing that POV:
S&P500 P/E Ratio vs Interest Rates
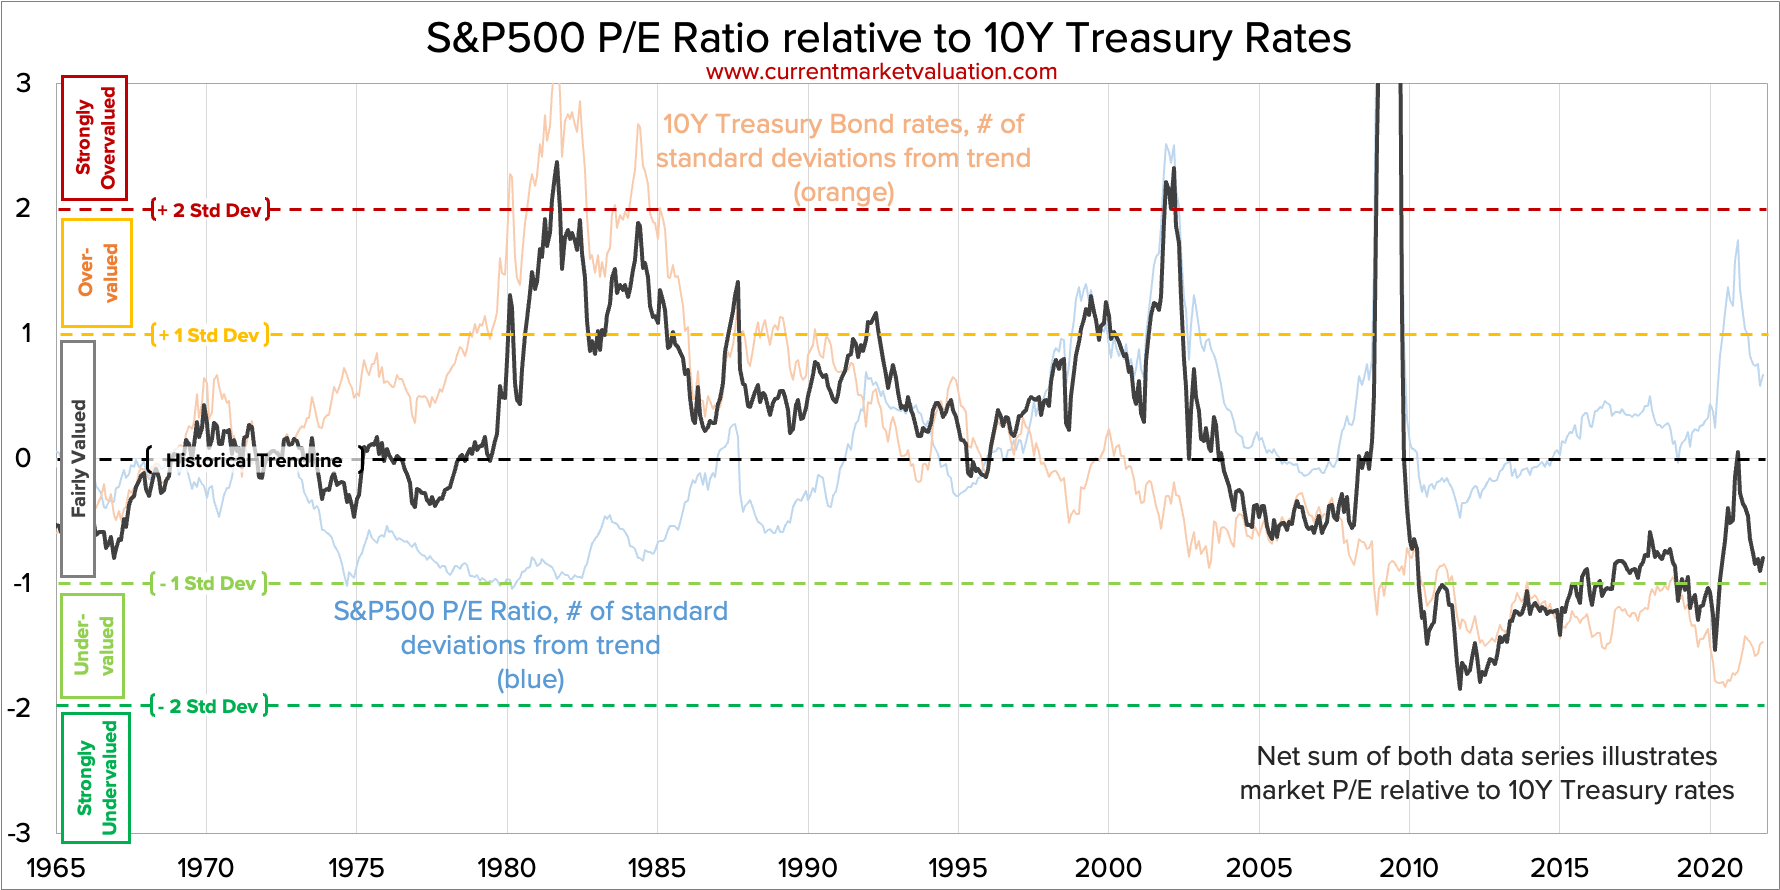
You look at that last chart though and you wonder whether equities are really undervalued as the chart suggests, or whether it's really that treasuries are massively overvalued with the Fed purchasing so many. After all, this is only showing the values of 2 asset classes relative to each other.
Going full circle back to the GMO article, the last critique I have is to question whether it's even possible to have simultaneous bubbles in almost every asset class. At that point isn't it really just inflation? Where is the money going to go when people pull out? (Side note I also disagree with their assertion that inflation makes the bubbles worse -- really it reduces the length of the fall back to trend)
And that's again where I see wealth at an all time high, massive appreciation in most asset classes and the only thing limiting inflation being weak consumption driven by fear. Will consumption pick back up slowly enough that the Fed can slowly unwind its balance sheet and hold asset prices relatively steady, or will strong action be necessary that causes a big correction?


 . Funny how these FED meetings charge up or shake out the market....for a day or 2 usually....btw I just hope he comes out and tells everyone to bend over and kiss their ass goodbye since the situation is f vcked….That way I can load up on more oil/gas and natural resources when they go down with everything else....give em hell, Jerome...